A quick approach for cost monitoring on Kubernetes
This article presents an approach to approximate the costs a specific project/team generates on Kubernetes, based on the ratio of resources allocated to them vs. the total resources in the cluster.
Our Kubernetes cluster is deployed using AWS EKS, and we use DataDog as a monitoring solution. The screenshots and pieces of code that illustrate this article are based on those technologies, but the general principles and formulas apply to any other stack.
The problem of cost visibility on Kubernetes
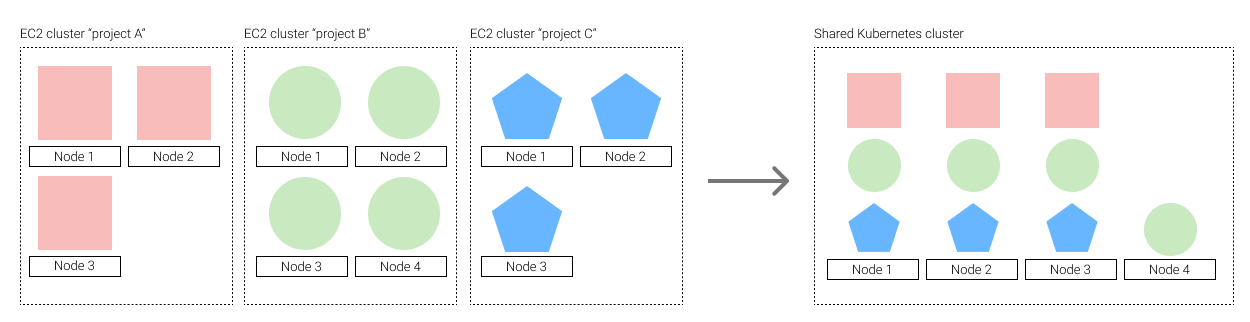
We recently migrated all of Glovo’s Machine Learning services to Kubernetes. Before that, each of our services used to run in a dedicated cluster of EC2 instances (cloud VMs).
One of the results we expected to achieve with this transition was a significant cost reduction. With Kubernetes, all our projects (big and small) would be able to share the same underlying infrastructure and thus leave less room for idle resources.
Before the transition to Kubernetes, each team could go to the AWS Cost Explorer and see how much money each of their projects was spending. Naturally, we wanted to maintain that level of visibility.
The challenge with Kubernetes is that, because different pods share a pool of resources, attributing a part of the total cost to a specific project (or team, or environment, …) is not trivial. At the moment, the built-in budgeting tools of most cloud platforms I know (AWS in our case) do not provide a straightforward way to explore these costs either, so we were left with two alternatives:
- Install a 3rd-party component to monitor costs (we considered Kubecost and CloudZero)
- Approximate the cost based on the metrics we were already processing
We briefly considered option (1), but decided to hold off on adopting a solution that would require extra maintenance and/or procurement.
What follows is our implementation of option (2): A low-hanging-fruit approach to cost monitoring on Kubernetes.
Approximating costs on Kubernetes
If you are deploying on a cloud provider, the cost of running a specific project in Kubernetes would come down to a formula like this one:
cumulative sum over time:
  share of resources allocated to the project * cost of those resources
For instance, if a project P runs 5 pods for 1 hour, and each pod takes up 30% of machine M, then it will be charged 0.3 * 5 * price/hour of M.
Of course, projects incur in other costs like databases, block storage, load balancers and network traffic. Fortunately, the budgeting tools offered by cloud providers can already segment those costs, so we’ll focus on ‘compute’ power.
To run this calculation, the cost monitoring tool needs to be aware of the machine each pod is running on, and the current price of that machine.
Our goal was to spare the need for an extra service backed by its own database, and we decided to leverage the metrics we were already collecting in DataDog.
Assuming all the machines in the cluster have similar prices per unit of CPU/memory, you can approximate the cost with this formula:
cumulative sum over time:
  cost of running the cluster * ( share of resources allocated to the project / sum of resources in the cluster )
If that were not the case, you would need to partition this formula by instance type to get a more accurate approximation.
Part I: Getting the total cost of running a cluster
The first thing we needed to do was tag all nodes of our Kubernetes cluster (EC2 machines in AWS) with a set of tags that uniquely identified our cluster. Then, we used those tags to create a Budget that tracked the cost of those machines over time (in our case with a monthly periodicity).
DataDog’s integration with AWS Billing captures a gauge metric with the actual and forecasted costs for that budget.
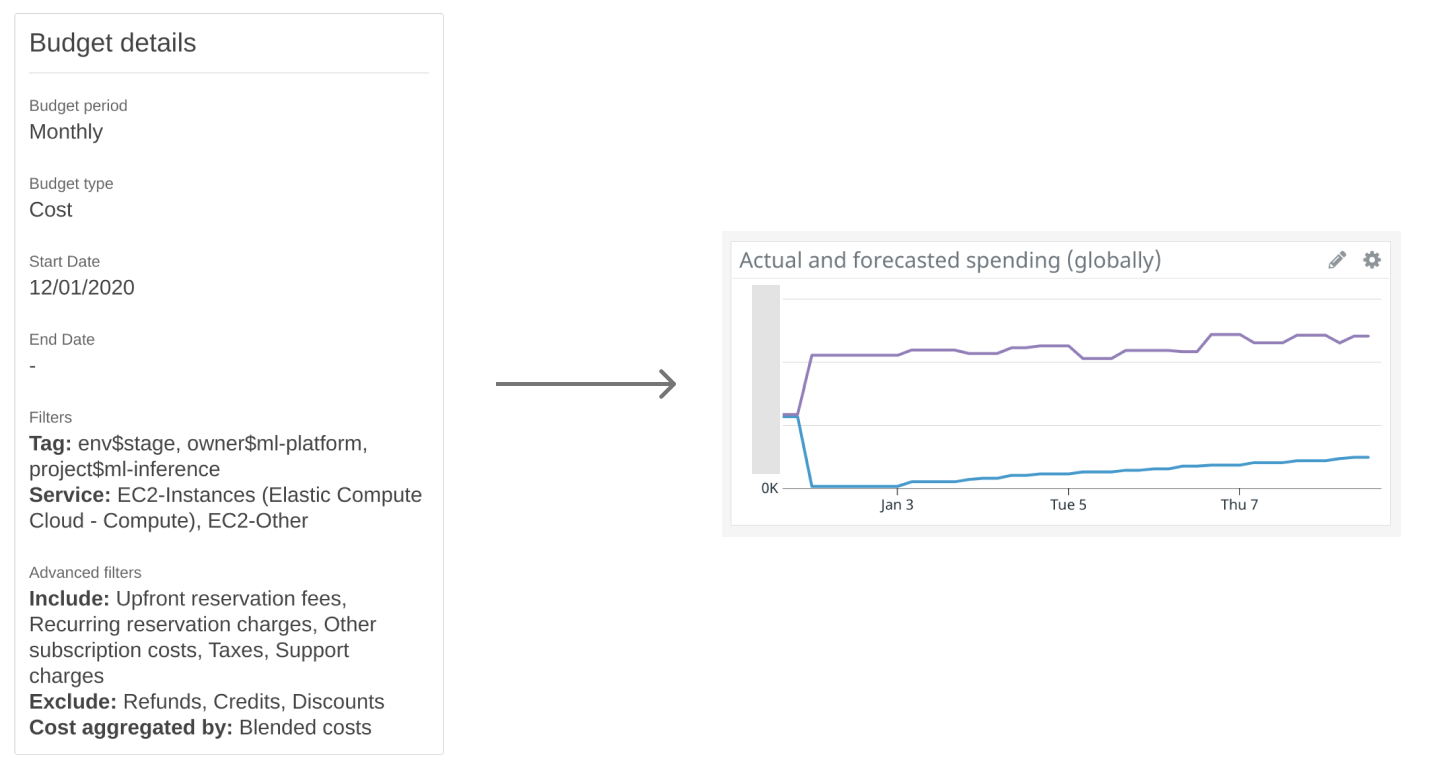
Depending on your particular goals, you may want to include the cost of running Kubernetes (the cost of the control plane, the network, any load balancers…) in the budget.
Part II: Collecting Kubernetes metrics
Before, we said costs were a function of the resources allocated to each project. Therefore, we need to configure our monitoring solution to track the resource utilization and requests for all pods, and inject those custom labels into the metrics it emits.
In our case, we are installing DataDog agents through the official Helm chart and instructing it to segment the metrics it collects about the pods with a bunch of relevant custom pod labels.
nodeLabelsAsTags:
  glovoapp.com/instance-type-family: "instance-type-family"
  glovoapp.com/instance-type-generation: "instance-type-generation"
podLabelsAsTags:
  glovoapp.com/team: "team"
  glovoapp.com/project: "project"
  glovoapp.com/service: "service"
  glovoapp.com/env: "env"
  glovoapp.com/version: "version"
After this, we have all the data we need in order to start crafting our formulas.
Part III: Calculating the share of resources allocated to each project
Here comes the core of the problem: Getting an idea of what percentage of the total cost of the cluster can be attributed to each specific project (and when I say project, I really mean any transversal label that identifies your workloads; for instance, a team, or a business unit).
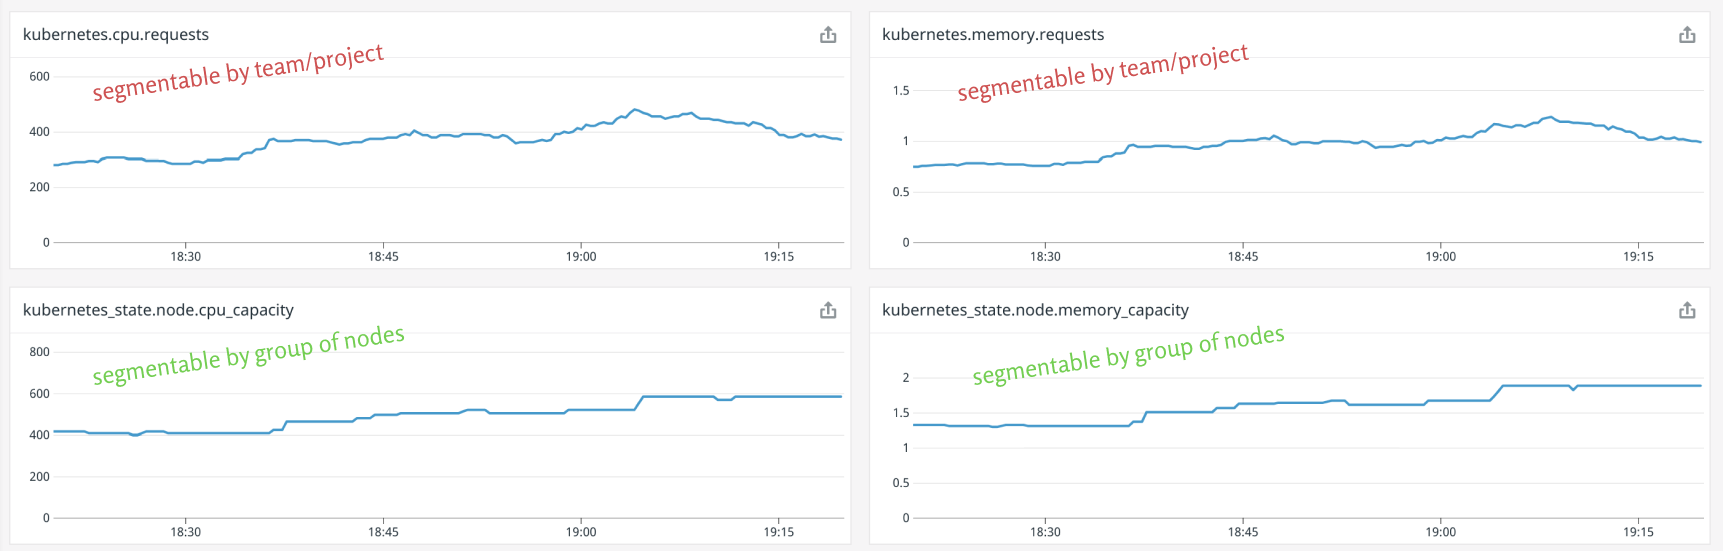
The following formula gives us the share of resources a specific resource was allocated at a specific point in time t.
let cpu_over_total = kubernetes.cpu.requests(project) / kubernetes_state.node.cpu_capacity
let memory_over_total = kubernetes.memory.requests(project) / kubernetes_state.node.memory_capacity
# other resources over total

let resources_over_total = mean(cpu_over_total, memory_over_total, ...)
Now, because we’re interested in how costs evolve over time, we calculate the cumulative sum over t and multiply it with the total cost of the cluster (which should also be cumulative) to get our final cost per project.
with resources_over_total
let actual_spend = aws.billing.actual_spend

cumulative_sum(resources_over_total) * actual_spend
Part IV: Making these insights actionable for teams
Access to this data helped us understand and validate the impact of our migration to Kubernetes.
However, we are a platform team, and as such, one of our goals is to make these insights accessible and actionable for the teams we support.
After a few iterations, we settled on a customer-oriented dashboard with the following features:
On top of the dashboard, we:
- Are transparent about the purpose and caveats of the dashboard.
- Provide general guidance on how to use it.
- Allow customers to filter by environment, team or project.

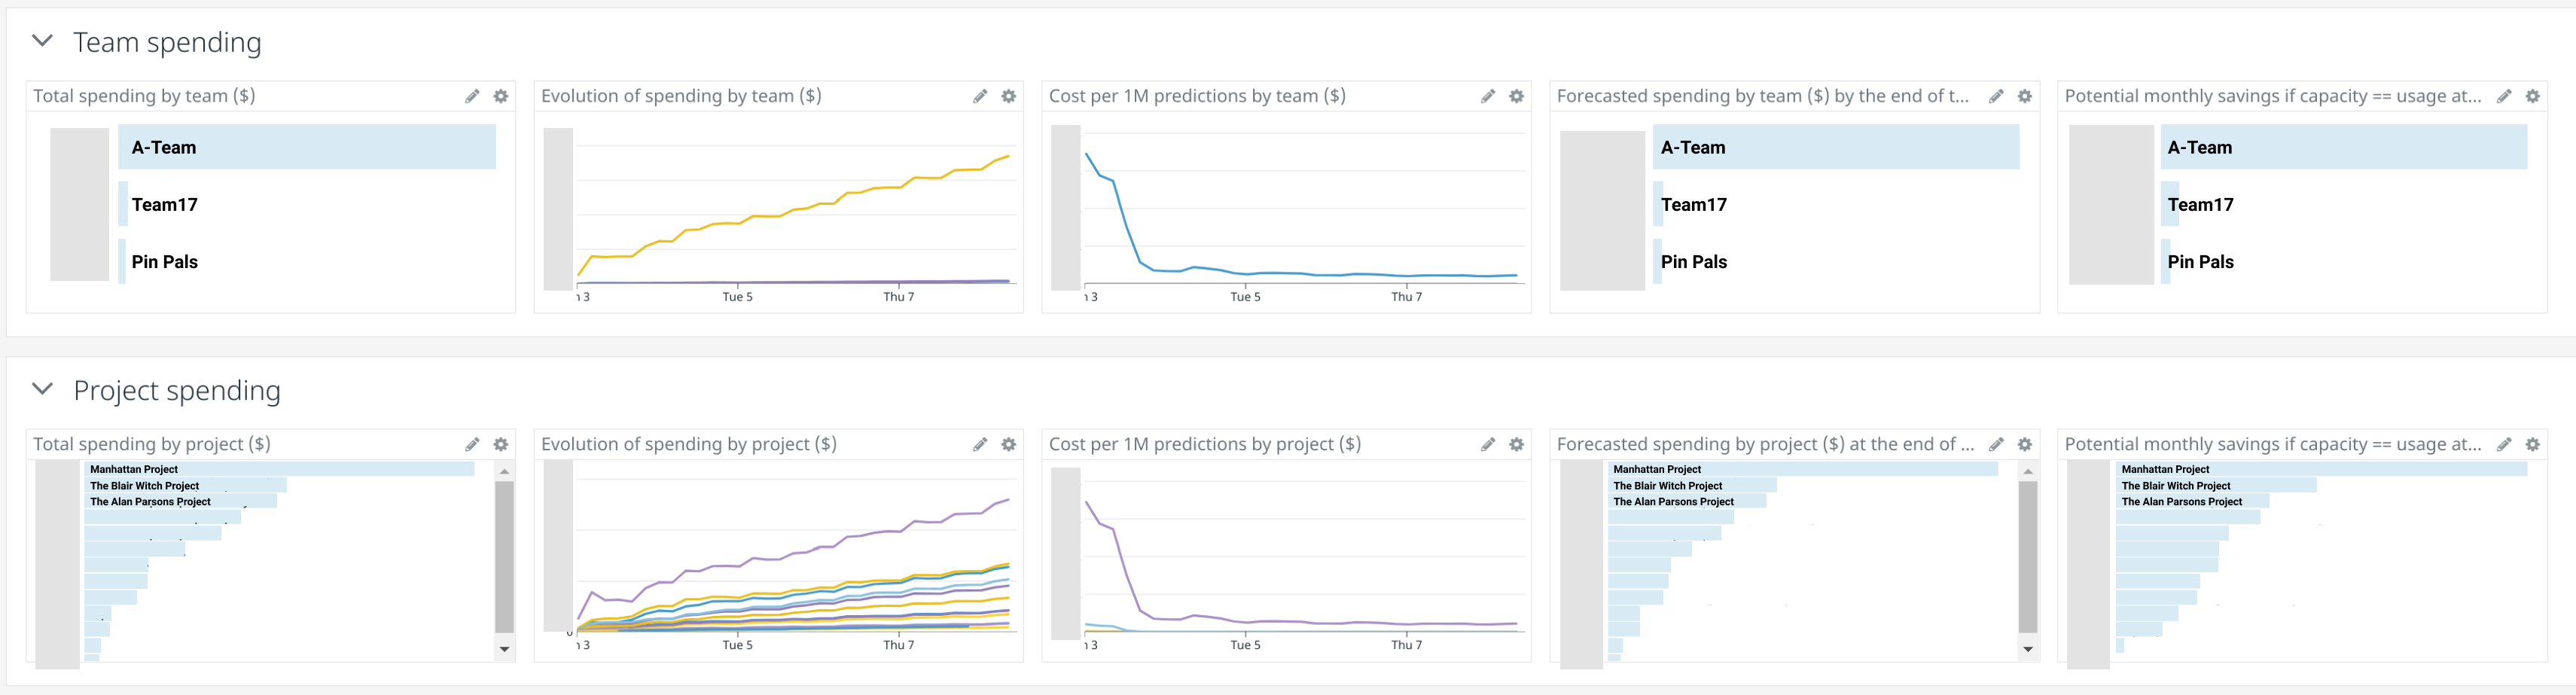
Next, we present two isomorphic sections, one segmented by “team” and another segmented by “project”. In there, we present:
- The spending generated by each team/project.
- The evolution of that spending.
- The spending normalized by prediction (we use this to put costs in the context of the units of work those workloads are performing; as per usual, the semantics or complexity of the work done by each service may vary wildly, so we have to take it with a grain of salt).
- The forecasted spending, or how much that team/project will consume by the end of the budget period, given the same traffic patterns displayed so far.
- The potential savings if the team/project was 100% efficient. This gives teams a quick idea about the ROI of spending part of their resources into making the services more efficient.
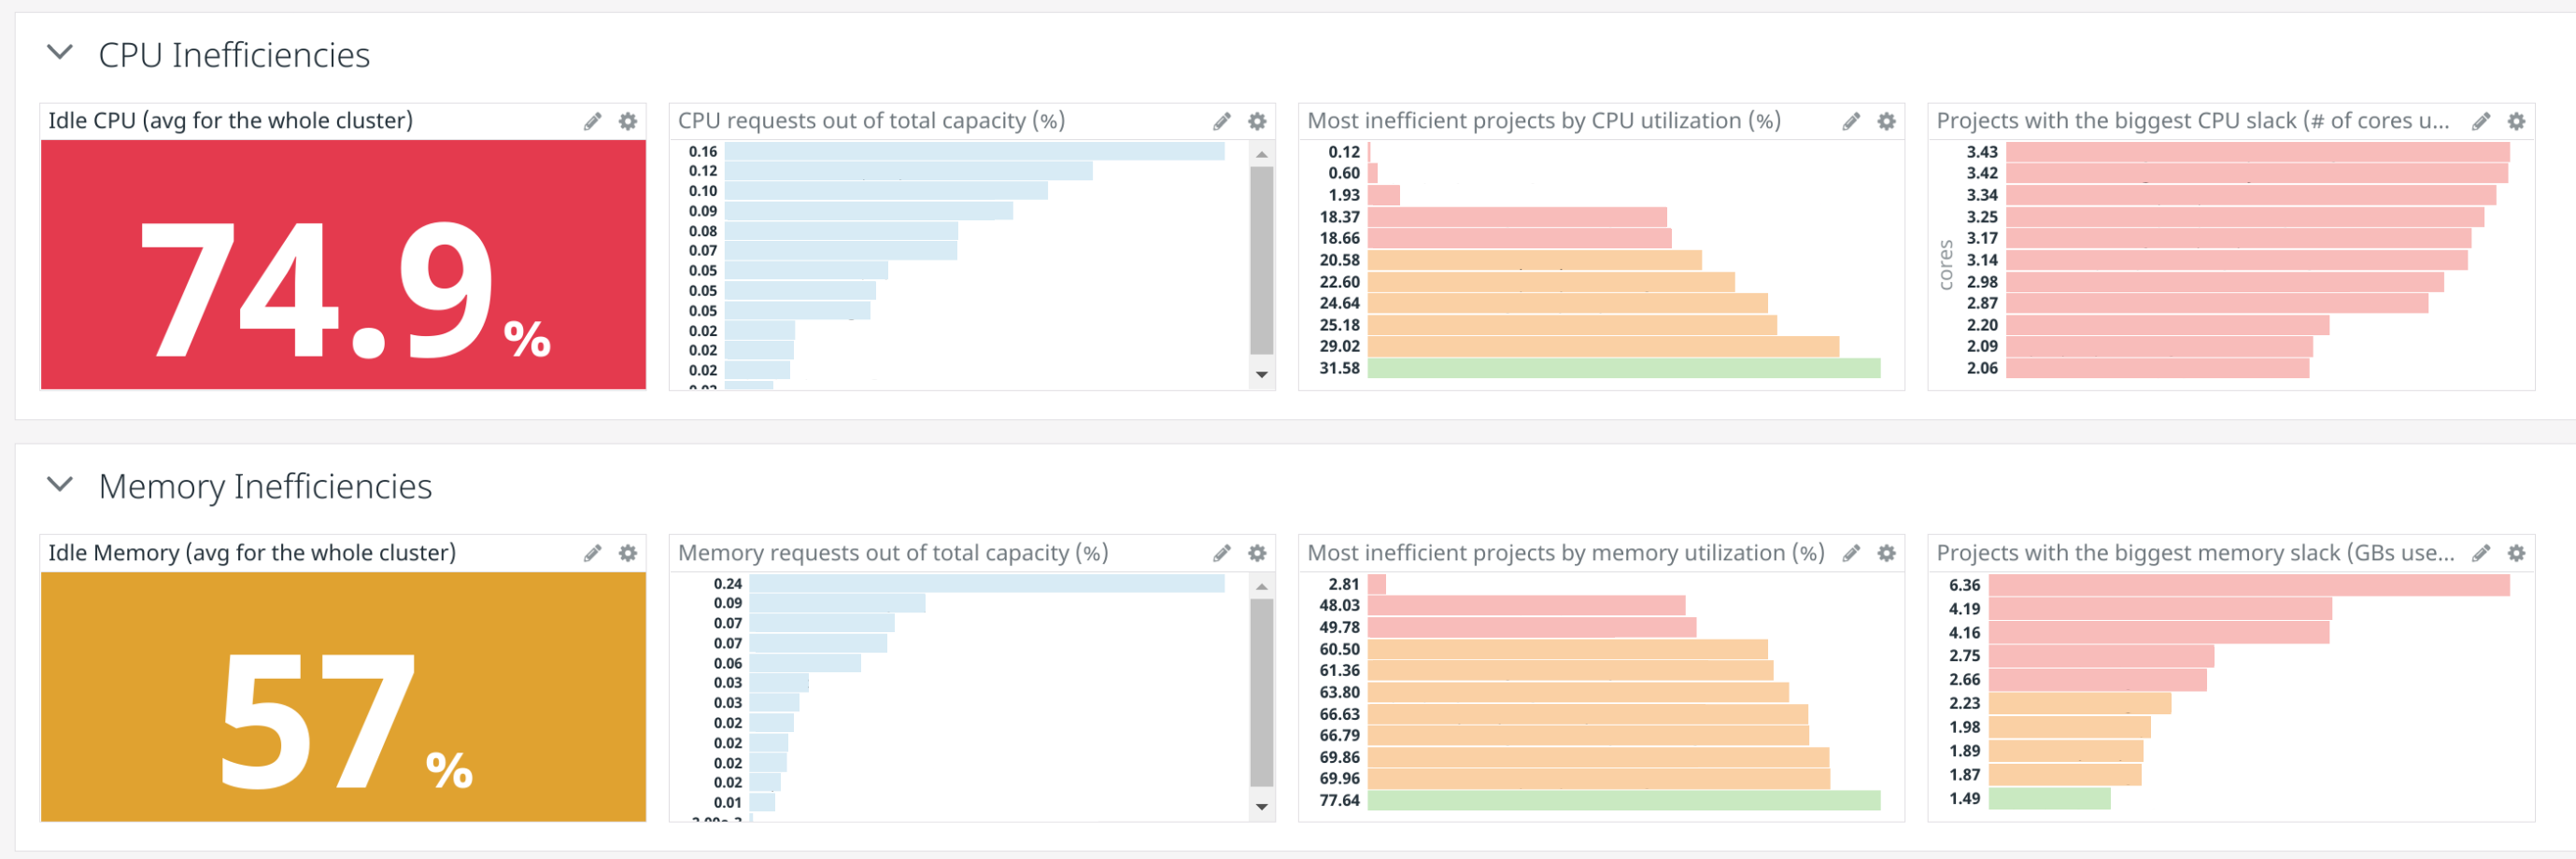
The last 2 sections focus on inefficiencies and are useful for teams that want to find out why the cost of a specific project has skyrocketed, or whether we can achieve some quick wins and save a few thousand bucks per month with just a few hours of work. Inefficiencies often come in the form of:
- Projects using much fewer resources than they request.
- Nodes with idle resources due to a mismatch in how these resources scale with respect to the workloads. For instance, if all our workloads requested CPU:memory in a proportion of 1:1 (say, 1 core:1 GB), but our machines were optimized for memory and had a proportion of 1:4, then we would keep 3/4ths of memory idle all the time.
Reducing those inefficiencies as much as possible is part of our “Cost optimization” strategy, and a shared responsibility between platform and product teams at Glovo.
I wanted to make this article as useful as possible for teams in the same situation as ours, so I’ve open-sourced the dashboard we are using. You can find the Terraform + JSON code in this gist.
Next steps: More accurate cost monitoring
The basic premise of our guerrilla approach is to get a good value with minimal effort.
As your volumes grow and the projects deployed to your Kubernetes cluster become more diverse, it will make sense to start leveraging a proper cost monitoring solution that can:
- Determine the cost of a pod based on the specific machine it runs on (and works with different pricing systems such as Spot and Reserved Instances).
- Aggregate costs inside and outside of the Kubernetes cluster.
- Aggregate costs of multiple Kubernetes clusters and expose them through a single interface.
- Provide extra insights and recommendations.
- Integrate with existing enterprise tools for monitoring, messaging, or incident management.
If you’re interested in exploring more about this area, I’d recommend checking the Kubecost project.
More generally, some SaaS companies provide cost optimization services for the cloud (including integration with Kubernetes clusters). We’ve started exploring CloudZero, but I’m sure there are many alternatives. Perhaps some will list themselves in the comments section :)